
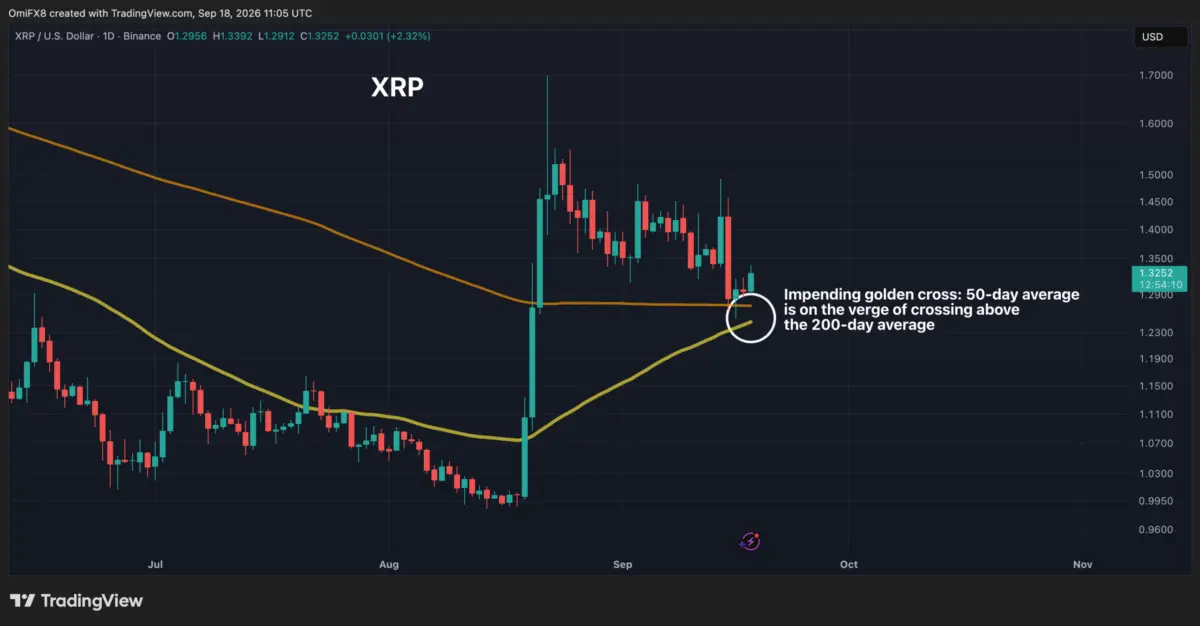
As the digital asset market moves into the latter half of September 2026, investors are closely monitoring a shift in capital flows that could signal a new phase for alternative cryptocurrencies. At the center of this technical focus is XRP, the payments-oriented digital asset, which is currently on the verge of flashing one of the most widely recognized bullish signals in technical analysis: the golden cross. This development comes at a time when Bitcoin’s long-standing grip on market share is beginning to loosen, providing a potential window of opportunity for altcoins to regain lost ground.
The impending golden cross on XRP’s price chart arrives as the broader market grapples with a complex macroeconomic and regulatory environment. Despite recent headwinds, including interest rate hikes from the Federal Reserve and legislative hurdles in Washington, the cryptocurrency sector has shown remarkable resilience. However, the internal dynamics of the market appear to be shifting, with traders increasingly looking beyond Bitcoin for short-to-medium-term returns.
The Mechanics of the XRP Golden Cross
A golden cross occurs when an asset’s short-term momentum, typically measured by its 50-day simple moving average (SMA), climbs above its long-term momentum, represented by the 200-day SMA. For chart analysts and momentum traders, this crossover is often interpreted as a confirmation of a long-term trend shift from bearish to bullish. The logic behind the indicator is that recent price strength is beginning to outweigh historical averages, often leading to a self-fulfilling prophecy as trend-following algorithms and retail investors enter the market simultaneously.
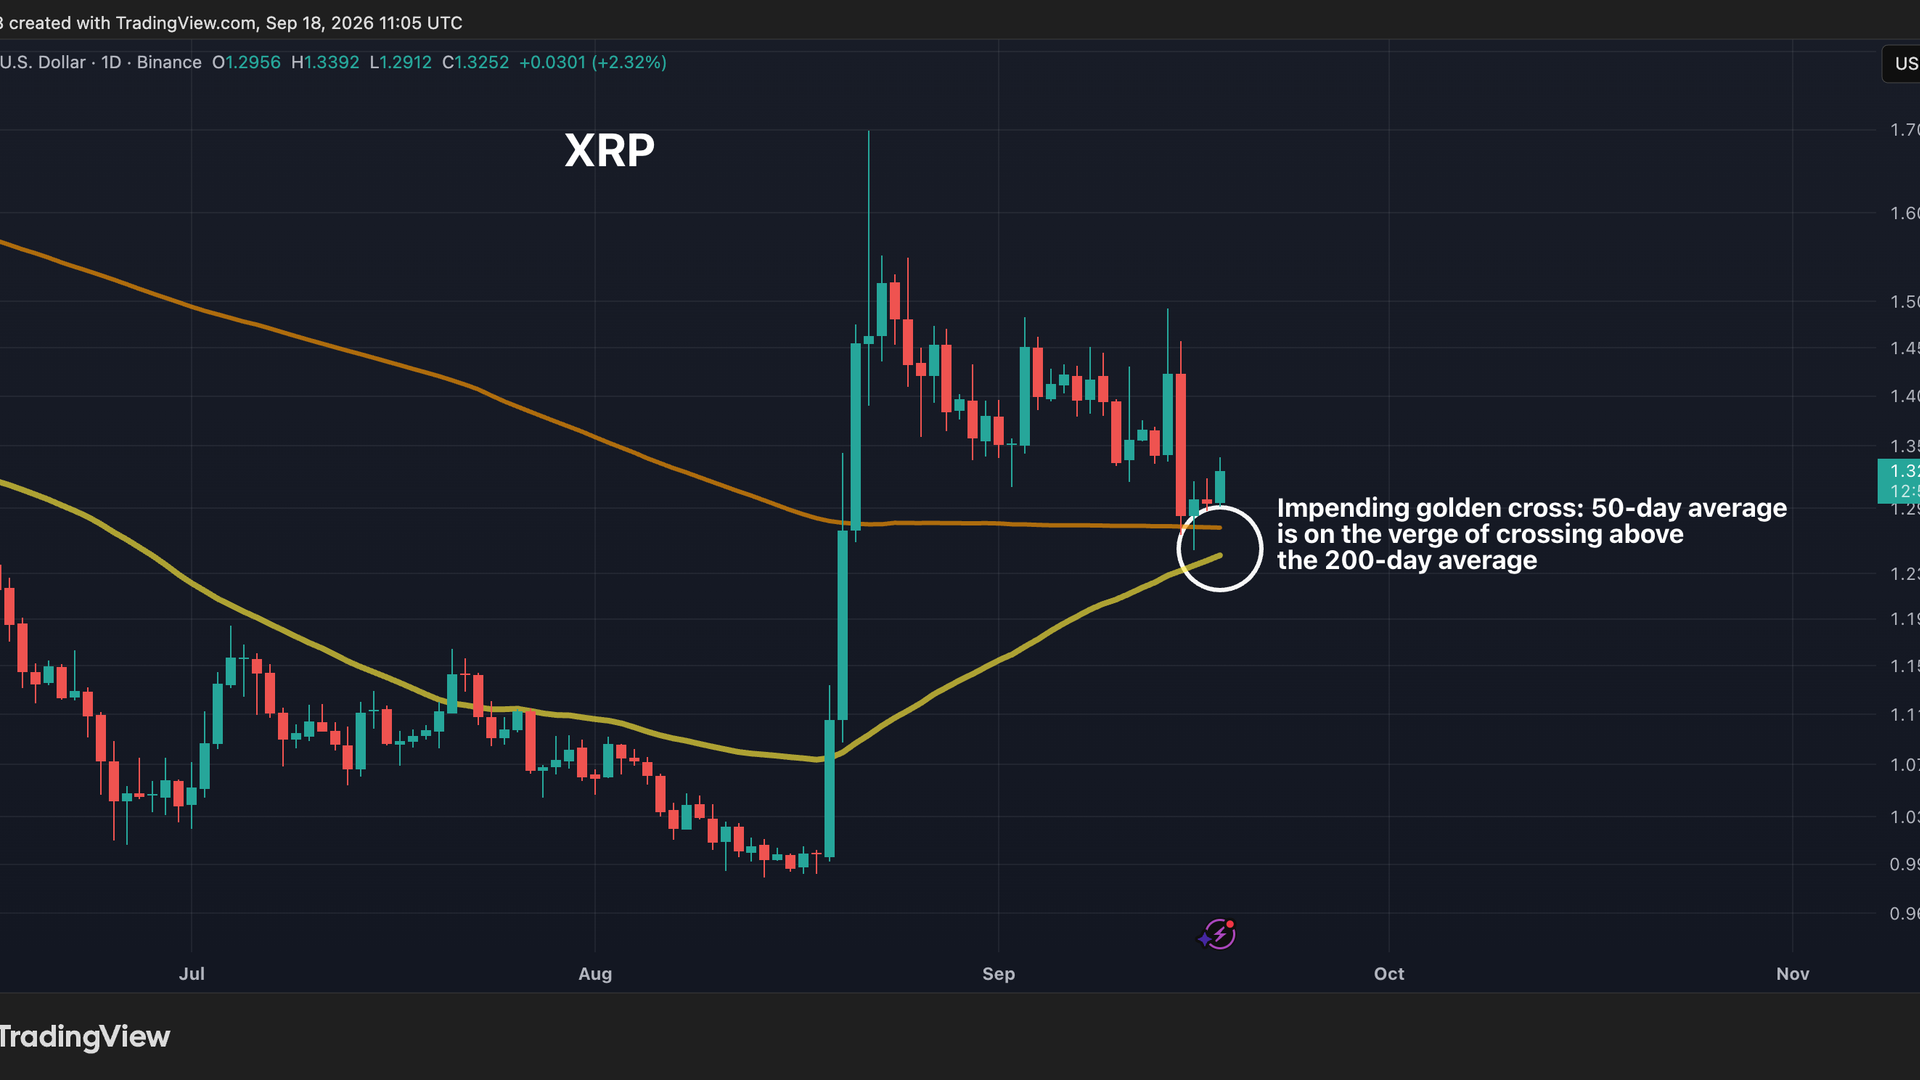
Currently, XRP’s 50-day moving average is hovering approximately 2% below its 200-day moving average. This is the narrowest the gap has been since the asset’s last golden cross in August 2024. While the crossover has not yet been finalized, the trajectory suggests that a confirmation could be imminent. This technical setup is particularly noteworthy because it follows a similar signal recently confirmed by Bitcoin, which historically serves as a bellwether for the rest of the market.
However, seasoned market participants often view technical indicators through a lens of historical context, and for XRP, that context suggests a need for tempered expectations. While the golden cross is theoretically a long-term bullish signal, XRP’s track record with this specific pattern is characterized more by short-term volatility than by sustained, multi-year rallies.
Historical Performance and the Reliability Gap
Data from the previous 16 golden crosses in XRP’s history provides a sobering perspective for those expecting a permanent upward trajectory. According to historical price action, none of these 16 previous signals managed to sustain themselves for a full 12-month period. In every instance, the golden cross was eventually terminated by its bearish counterpart, the "death cross"—a pattern where the 50-day moving average falls back below the 200-day average.
The lack of long-term endurance for these signals suggests that XRP often experiences "fakeouts" or bull traps, where initial momentum fails to attract enough sustained buying pressure to overcome long-term resistance levels. Of the 16 recorded instances, six did not even manage to survive the three-month mark before the trend reversed.
Despite this lack of long-term reliability, the golden cross has historically been a potent catalyst for significant short-term gains. For the 10 instances where the signal lasted at least three months, the returns were often dramatic. Five of those cases saw price surges ranging from 85% to over 1,000%. Notable examples include the April 2017 cross, which preceded a staggering 1,009.6% rally, and the February 2021 cross, which led to a 135% gain. These figures indicate that while the golden cross may not guarantee a permanent bull market for XRP, it frequently serves as a precursor to explosive, high-velocity price action.
Bitcoin Weathers a Stormy Week
While XRP prepares for its technical milestone, Bitcoin continues to serve as the foundation of market stability. The premier cryptocurrency has faced a gauntlet of challenges over the past week, most notably a Federal Reserve interest rate increase that typically exerts downward pressure on risk assets. Additionally, the digital asset industry faced a political setback with the Clarity Act, a piece of legislation aimed at providing regulatory definitions for stablecoins and digital assets, which hit unexpected hurdles in the legislative process.
Despite these factors, Bitcoin has remained remarkably steady, trading near the $78,000 mark. This price level is roughly unchanged from a week ago, suggesting that the market has already priced in much of the current regulatory and economic uncertainty. Analysts remain broadly optimistic about Bitcoin’s prospects, noting that its ability to hold its ground in the face of "hawkish" central bank policy is a sign of increasing institutional maturity.
However, Bitcoin’s price stability has come at the cost of its market dominance. The Bitcoin dominance rate, which measures Bitcoin’s share of the total cryptocurrency market capitalization, has recently slipped to a one-month low of under 59%. This decline is a key metric for traders, as it often indicates a "rotation" of capital. When investors feel that Bitcoin has reached a temporary plateau, they frequently move funds into higher-beta altcoins in search of greater percentage gains.
Altcoins Lead the Broad Market Advance
The drop in Bitcoin dominance has coincided with a sharp acceleration in the altcoin sector. While the "majors" like Bitcoin and Ethereum have seen more modest movements, several prominent tokens have posted significant gains. In a recent 24-hour window, assets such as Uniswap (UNI), Near Protocol (NEAR), and Arbitrum (ARB) surged by nearly 30%.
This rally in altcoins is being driven by a combination of technical setups and speculative hope regarding future adoption. Traders are increasingly focused on the potential for the Securities and Exchange Commission (SEC) and the Commodity Futures Trading Commission (CFTC) to move toward more favorable crypto adoption frameworks. Furthermore, the market is keeping a close eye on the progress of the Bitcoin Reserve Bill, which, if passed, could fundamentally alter the way digital assets are held at the institutional and governmental levels.
Alex Kuptsikevich, the chief market analyst at FxPro, noted that while the shift toward altcoins is evident, the market has not yet reached a state of "euphoria." In a recent assessment, Kuptsikevich pointed out that neither the altcoin season index nor general market sentiment has hit the extreme highs typically associated with the peak of a cycle. This suggests that the current rotation may still be in its early stages, providing a cautious but optimistic outlook for the coming weeks.
Today’s Signal
The historical data regarding XRP’s golden cross serves as a vital tool for risk management. The 16 prior instances show a clear divide in outcomes. While 10 of the crosses survived at least 90 days, the remaining six were "terminated" almost immediately by a shift in market sentiment. Even for the successful signals, the losses in the underperforming cases reached as much as 32% within a three-month window.
The primary takeaway for market participants is that the golden cross is not a standalone crystal ball. When used in isolation, it can be a lagging indicator that captures the tail end of a move rather than the beginning. However, when viewed in conjunction with Bitcoin’s declining dominance and the broader surge in DeFi and Layer 2 tokens, the impending XRP signal adds another layer to the narrative of a diversifying market.
As September 18, 2026, unfolds, the convergence of technical patterns and macroeconomic resilience suggests a market that is testing its boundaries. Whether XRP can break its historical trend of short-lived golden crosses remains to be seen, but the current environment of altcoin acceleration provides a backdrop that is markedly different from previous years. Investors are advised to remain alert as the 50-day and 200-day averages move toward their inevitable meeting point.